
Archive

Infographic: Growing Up With Technology
By: Jaclyn Norton. Technology is transforming today's educational landscape, reaching children's fingers before they reach their shoes. According to the infographic below from LearnStuff.com, 70% of children between the ages of 2-5 can use a computer mouse, while only 11% can tie their own shoes. Today's generation is growing up with technology, proving to reject traditional beliefs about how people learn. 90% of students think tablets help them study more efficiently, and cause them to read 1.5 more books annually. See the infographic below to see students different interactions with technology along their scholastic path, from grade school to graduation.
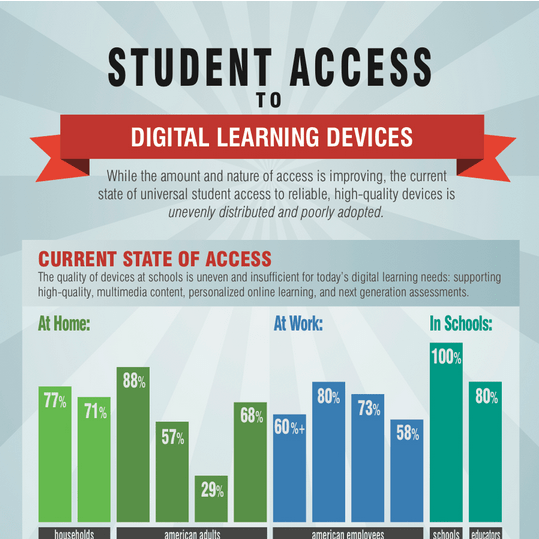
Infographic: Student Access to Digital Learning Devices
Digital Learning Now! (DLN) today released “Funding the Shift to Digital Learning: Three Strategies for Funding Sustainable High-Access Environments,” the first in the DLN Smart Series of interactive papers that provide specific guidance regarding adoption of Common Core Standards and the shift to personal digital learning.
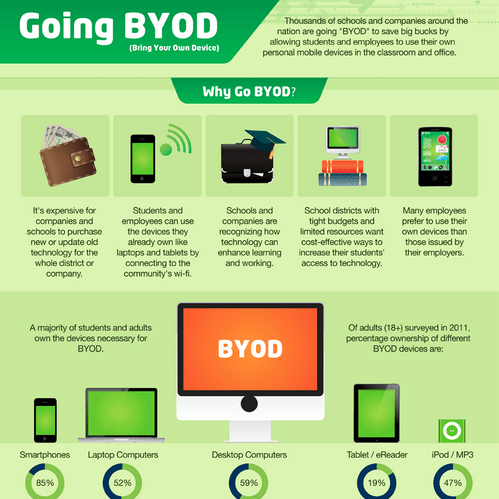
Infographic: Are You Going BYOD?
As another school year begins many leaders will again question whether or not to implement a Bring Your Own Device (BYOD) or Technology (BYOT) policy in their classrooms. The infographic below highlights many of the pros and cons to letting students use personal devices in the classrooms.
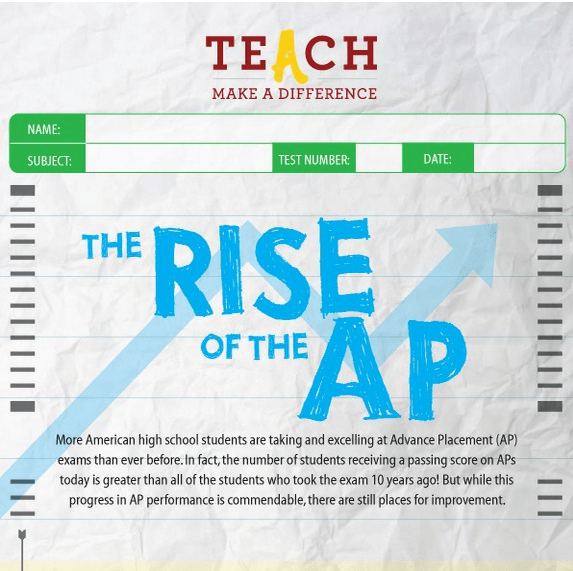
Infographic: The Rise of the AP
Tom Vander Ark often says that one of the best ways to introduce online or blended learning in high schools is to offer additional Advanced Placement (AP) courses online. It’s a win-win for the school and students. Schools offer additional desirable classes without dramatically increasing costs and while testing…

Infographic: How to Spend Your Summer
Summer is fast approaching. When the last bell rings and students head home for the summer months, many students experience what research is calling "summer learning loss," which largely contributes to the growing achievement gap in the U.S. The infographic below outlines effective ways students can brush up on their studies, skills and knowledge over the summer through internships, jobs, volunteer work and independent study.
Infographic: The Potential of Edu Data
The Michael & Susan Dell Foundation recently released an infographic on the Ed-Fi Tool Suite, a universal educational data standard and tool suite, showcasing its significant gains in momentum and use in eight K-12 state education agencies, districts and vendors and the potential of educational data.
Infographic: Are eBook Readers Reading More?
eReaders allow you to carry your latest interests around on one small device, which often also houses your email, documents, photos and more especially if you're working off a device like the Kindle Fire or iPad. So if you can carry around all your books and pick up the latest bestseller with a few taps and swipes, will you be inclined to - read more?
Infographic: How to Extend the Reach of Excellent Teachers
Did you know that only 25 percent of classes are taught by excellent teachers? We need to find ways to leverage great teachers and extend their talents to more students through the use of technology, new classroom models, and more.
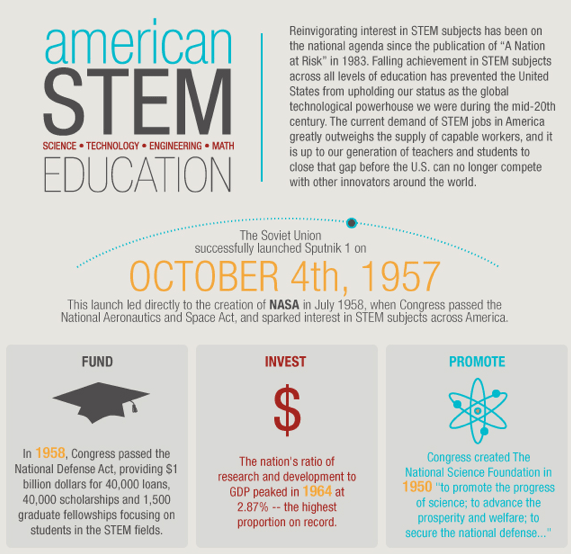
Infographic: The Decline of STEM Education in the U.S.
A focus in science, technology, engineering and math (STEM) began officially with the launch of Sputnik 1 October 4, 1957. This launched the beginning of NASA and government-mandated funding for students interested in STEM careers. From this point forward, a series of dominos fell on funding, scholarships, foundations and more to stimulate U.S. growth and expansion of science. This had a dramatic affect on generating increased interest in STEM until 1992.
Infographic: Consequences of Teaching to the Test
Learning today has become highly standardized. We ask students to reach a learning standard and test it with statewide tests that identify whether we successfully taught them what they needed to know to clear the bar. Yet, are we only teaching students to pass a standardized test? Best Masters in Education published some compelling data recently that makes us think twice about "teaching to the test."