
Using Mastery Data to Measure Growth in Student Learning

By: Scott Ellis
What is the most important data in K-12 education? If we think the primary purpose of classrooms, schools, and our education system as a whole is to cultivate and facilitate learning by students, then the most important data is clear, accurate information about student learning progress. While this seems self-evident, it is a huge challenge for the existing education system. Mastery learning offers the potential to provide this incredibly valuable data at scale and in real-time so it can be used by educators in their efforts to continuously improve their ability to support students. It can also be used by the students themselves to guide their individual learning journeys–this is a key element in growing student agency.
Two Types of Mastery Learning Data: Status and Progress
The first level of data that can be provided by mastery learning is mastery status: the learning objectives a student has mastered at a point in time. This data is extremely useful and can be used to guide teaching and learning on a daily basis; once we know what a student knows and what she is ready to learn, we can figure out how to support her effectively. Students can also help drive this process; if a student has a gap in her learning or a skill she needs, she has a clear structure that gives her the words to ask for help, seek resources, or say she is ready to try to demonstrate mastery.
However, after several months of mastery learning, it becomes possible to generate the next level of data: mastery progress. This is calculated by comparing a student’s mastery status at two different points in time and determining which new objectives have been mastered. This is a very simple calculation, and once the five key elements of mastery learning are in place (learning objectives, mastery thresholds, etc.) the data is very easy to gather and analyze. This can be examined for each individual student, but it can also be aggregated, sorted, and analyzed for classrooms, schools, and even districts or states. In MasteryTrack we call this aggregated summary of student learning a Mastery Learning Report. Although this data can be generated in real-time over any time period, one logical time period that aligns well with the current education system is an annual view.
The Mastery Learning Report
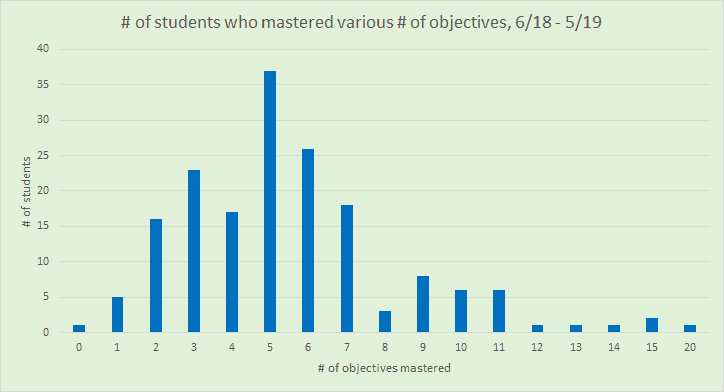
We recently generated a Mastery Learning report for the 2018-19 school year for a school that has been using MasteryTrack for Spanish Interpersonal Oral with 170 students and several teachers in multiple classes. The school had actually been using the system in the previous year as well, so by June of 2018, we had a very solid starting point for measuring mastery-based student learning progress. We took the learning status of each student in June 2019 (the endpoint) and subtracted the status in June 2018 (the starting point) to determine the amount of learning that took place during the 2018-19 school year.
Spanish Interpersonal Oral is organized into several ability categories (multiple levels of novice, intermediate, and advanced) and each level has several specific learning objectives. For every student we calculated the amount they learned during the year: the number of learning objectives mastered. We then sorted this data in a few ways and calculated a few useful averages:
- Sorted based on number of learning objectives mastered
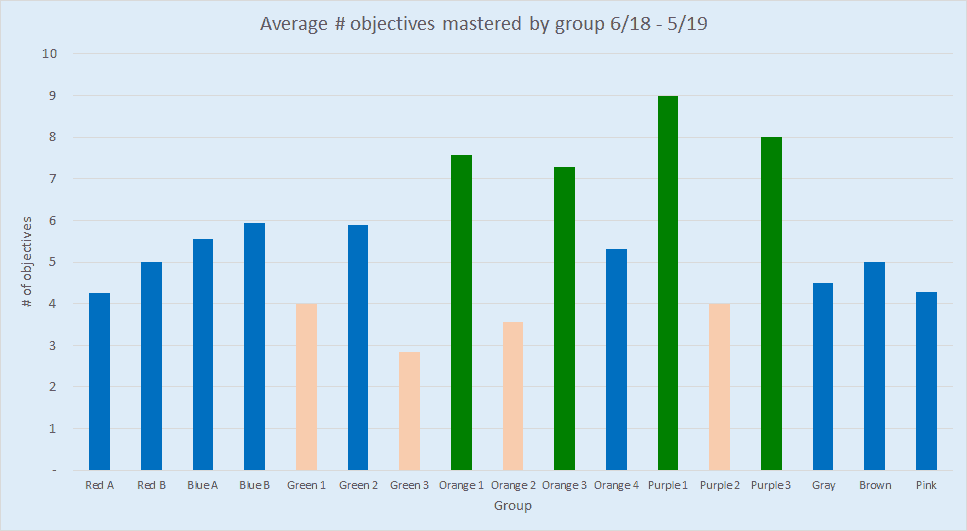
- Sorted based on student group (classroom)
- Sorted based on initial learning level (not all objectives are of comparable size and some are more difficult than others)
- Calculated average number of objectives mastered for all students
- Calculated average number of objectives mastered by student group (classroom)
- Calculated average number of objectives mastered by initial learning level
Overall, students mastered 5.5 objectives during the year. Students who started at the novice level mastered nearly 7 objectives on average, while students starting at intermediate levels averaged closer to 4.5. Several students mastered 10 objectives or more, while others mastered 2 or fewer. Some groups of students mastered more than others, and some groups had very consistent growth for all students while others varied widely.
This data is not complex, and it is very easy to manipulate. However, it is the right data and it enables educators to ask several types of questions that can guide continuous improvement in the teaching and learning process:
- How did we do last year as an instructional team in our efforts to enable learning for students in our school? Are we happy with these results? Why or why not?
- What went well that we might want to continue or expand in the future to help enable our students to learn more?
- What did not go as well as we hoped or what challenges did we encounter, and what associated changes might we want to make in the future?
- What can we learn from the stories of individual students who excelled or struggled?
- What can we learn from groups that enabled more learning for students or from those groups where students learned less?
- What can we learn about groups that enabled more consistent learning for students or more varied results?
- What broader patterns do we see, and what might we do to continue them, reinforce them, or change them?
In a conversation with educators to discuss the Mastery Learning Report and analyze the results, teachers were quickly able to describe the cases of individual students and identify patterns. For example, one teacher noted that several of the students who learned the most are actually multi-lingual because they speak English as well as another language at home, and this helps them adopt Spanish more quickly. A few students were quickly characterized by teachers as particularly diligent and hard-working students, leading to outstanding results in Spanish as well as their other classes. And teachers knew that a few of the students had traveled to Spain with their families recently, and this led to an improvement in their performance in Spanish Interpersonal Oral.
Mastery Learning Data Enables Continuous Improvement
However, while this kind of student-by-student analysis is exactly what the progress data from MasteryTrack is designed to enable, the focus now needs to shift towards continuous improvement. The individual stories of each student are critical data points, but the key is what actions educators can take to build on approaches that are working well and to change approaches that are generating less student learning. This will be the next stage of the conversations we have together in our ongoing journey of innovation. All of this now can be driven by clear and detailed data about student learning, and a mastery-based structure makes this all possible for any teacher and every student. We now have the most important data in K-12 education. Let’s use it to help our students!
For more, see:
- Workspace Education: A Creative Approach to Competency- and Project-Based Science
- The Case For Competency-Based Education
This blog is part nine of a series on mastery learning, sponsored by MasteryTrack. If you’d like to learn more about our policies and practices regarding sponsored content, please email Jessica Slusser. For other posts in the series see:
- Pulling It All Together: Examples of Integrating the 5 Elements of Mastery Learning
- The Key to Enabling Data Driven Instruction in the Classroom: Getting Teachers the Right Data
- How to Develop a Mastery Dashboard That Works
- Examples of Mastery Thresholds to Enable Mastery Learning in Multiple Subjects
- Demonstrating and Assessing Mastery, and Managing Mastery Learning Data
- Mastery Learning Objectives and Mastery Thresholds in the Classroom
- What is Mastery Learning?
- Does Mastery Mean Mastered?
Stay in-the-know with innovations in learning by signing up for the weekly Smart Update.
Scott Ellis is the Founder and CEO of MasteryTrack. You can find him on Twitter @MasteryTrack.


0 Comments
Leave a Comment
Your email address will not be published. All fields are required.