
Taking the Guesswork Out of Science
By: Regina Ahmann
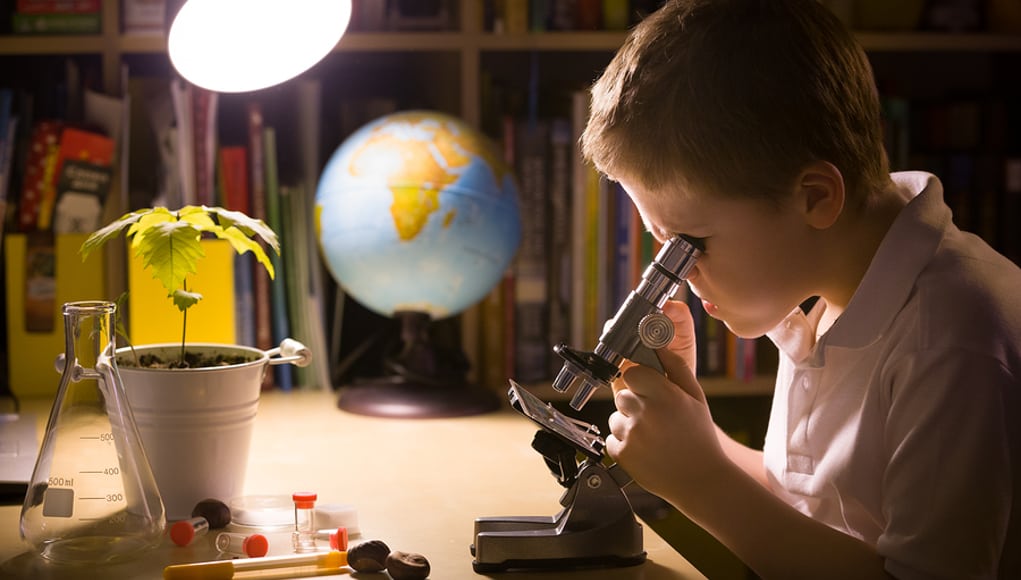
Workers in science- or STEM-related fields typically use multi-sensor packets to collect several points of data quickly and accurately. Copying those real-world tasks through the use of probes and data loggers in science instruction not only prepares STEM-focused students for the workplace but also streamlines experiment procedures, increases the accuracy of results, and heightens the engagement of all students, even those not planning on STEM careers.
I’ll use the example of environmental science, a hands-on subject where a virtually limitless pool of facts, experiments, and concepts describe the world around us. Investigations into acid rain, carbon footprints, sustainable living, water quality, and the greenhouse effect all help engage students in some of the most important subject matter of our age.
As any STEM teacher will tell you, getting students engaged with environmental science isn’t always easy. Take the automobile exhaust labs I do with my AP environmental science students:
Up until recently, the activity required a bottle, a syringe, some water, and Bromothymol (BTB) acid indicators. I used to divide the kids into teams and then task them with collecting pH, particulate and carbon dioxide readings from the car’s exhaust. For pH, we’d take a strip, tape it into the end of an index card, brush that strip with glycerin, and then hold the setup over the tailpipe of a running car for two minutes. The students would compare the results against a color range to figure out the pH. The indicators turned from blue to yellow or green, depending on the pH level, so basically, we compared the color-change on a scale of bluish to greenish to yellowish.
The process was not only inaccurate, but it really didn’t work for us because the changes were so minimal. In fact, most times the pH strips looked the same going out as they did coming back in.
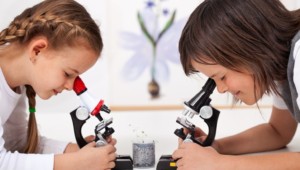
Fast-forward to the present and we are using probes and a portable, wireless data logger lab called Labdisc which has completely changed the way we do these labs. For the carbon dioxide lab, using appropriate safety precautions, we collect the car exhaust in two-liter bottles via a paper funnel positioned at the end of the car’s tailpipe. After two minutes, we seal the bottle, and bring it back to the lab where the students connect the data logger’s pH probes to the bottles and compare the exhaust’s pH levels to the pH of regular tap water.
We then repeat the experiment on several of the students’ cars, which have included a small hybrid, a large pickup truck, and everything in between. Students now have actual numbers that they could crunch — the same type of numbers that STEM professionals use in the workplace every day.
Value of the Real-World Element
Educators have become increasingly aware of the potential of sensors to bring a real-world element to student learning, particularly when it comes to makerspaces. According to THE Journal’s third-annual Teaching with Technology Survey, more than a quarter (27 percent) of school makerspaces now include scientific sensors and probes. While these devices are an obvious fit for a project-based learning environment such as a makerspace, my experience indicates that they are extremely useful for labs in regular science classrooms as well.
When students can get hands-on with data and these tech tools, particularly at the high school level, it really helps to prepare them for success in college and/or the workforce. Many Americans now consider this type of experience to be vital; in fact The Hechinger Report found that a little more than half of individuals surveyed felt STEM education currently places too little emphasis on practical applications.
Making Science a Walk in the Park
One of our first experiences with the data logger was when we received it as part of Boxlight STEM Day in December 2016. During the event, a select number of low-income elementary and high schools in the United States and Latin America worked with the company in a hands-on, inquiry-based learning event designed to help students learn critical STEM skills and understand how STEM disciplines apply to the world around them.
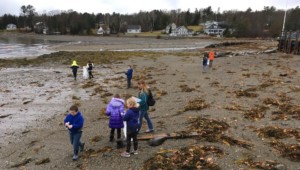
The event centered around an activity titled “A Walk Through the City,” in which students studied the relationship between temperature and humidity in several locations inside and outside their school, in both urban and green spaces. Using the data logger, students took measurements from their classroom door, moved on to a nearby grassy, treed area, and then an asphalted area.
We uploaded all of that data onto the students’ Chromebooks to produce a map that was basically a picture of the school from space. Using this color-coded, satellite image, we could see exactly where the kids walked as well as how the temperature and humidity changed as they moved about. And with a tap of a few keys, they produced a graph depicting those environmental variations.
My students analyzed the data, extrapolated, questioned, and presented possible explanations for the observed phenomena. Then they made suggestions for improving their school facilities based on their conclusions.
Aligning with State and National Science Standards
Helping students to truly grasp the intersection of human beings and their environment — and then aligning those observations and experiments with Next Generation Science Standards —requires a hands-on, highly interactive approach. Our Walk Through the Park labs, for example, got students out of the classroom and on walks around campus where they moved from paved areas to shaded areas to grassy, treed areas. As they moved about campus, they used our mobile labs to gather temperature, humidity, GPS, and other data.
If I didn’t have the data loggers — and if I wanted to gather data on the humidity — I wouldn’t have been able to do that. In my “old-school” approach, we’d all have had to stand outside with our alcohol thermometers, wait for a minute or two, and then move to a new location.
We also wouldn’t have the graphs, or the comparison data needed to be able to compare across multiple labs over time. And access to those graphs is no small thing: the American Educational Research Association has recommended the use of technology to provide scientific visualizations in investigations in order to help students connect school science to everyday situations.
Plus, I can do some really cool labs because I’m not taking a day-and-a-half to figure out how to create a graph, or how to most effectively collect relevant data that will engage and interest my students.
Getting Started
It’s important to select the right equipment for your labs, so I recommend starting by assessing your needs with the following questions:
What labs and activities will the devices be used in?
There are many, many different types of probes and sensors, so think about what you want to measure. I’d suggest jumping right in and learning along with the students, but if you’re really feeling apprehensive, you can start with one activity that you’re already very familiar with and just substituting the probes for the devices and techniques you had been using.
If you plan to start with a single activity, you can opt to buy only what you need and consider obtaining more in the future. However, buying an off-the-shelf set of sensors and probes is usually more cost effective than purchasing each item separately, so you might want to consider purchasing an appropriate set right off the bat even if you increase usage only gradually.
Also, if you’re stuck for ideas, the National Science Teachers Association offers an online collection of book chapters and Science journal articles on using probes.
What are your goals and objectives?
In addition to successfully completing the lab, you may want the activity to be collaborative. Or you may be planning for students to collect data outside of the classroom. The design, size, and durability of the data logger and probes or sensors that you choose will be influenced by such objectives.
How many will be needed for the class?
If students typically pair up or work in groups, you need to calculate the amount of equipment required.
Will they be used in conjunction with laptops, desktops, iPads/iPods, or smartphones?
The new equipment will have to integrate with any existing devices that you will use to analyze the data. A very handy way to move collected data to those other devices is via Bluetooth, so you may want to look for data loggers with that feature.
What funding do I have?
Money in public education is tight, so financial resources for obtaining probes, sensors, and data loggers can be limited. Below are some resources for STEM funding:
- STEMfinity shares over 1,000 grant opportunities throughout the United States, which can easily be searched by state.
- GrantWatch shares information on federal, state, city, local, and foundation grants and categorizes them by type (i.e., teacher grants, science, technology, etc.).
- DonorsChoose lets teachers post what they need for particular classroom projects so that donors can help fund the project.
- Digital Wish shares grant information and lets teachers build a wish list of tech products, let prospective donors know how it will help students, and start fundraising.
- Grants.gov shares information on federal STEM grants.
- TeacherGeek provides a map with access to a variety of STEM/STEAM funding opportunities.
- THE Journal posts regularly updated listings of funding opportunities for STEM education right on their site.
When I started using the new technology in 2016, I didn’t really set out to revolutionize the way my students learn about environmental science. I just wanted to try out a promising new tool. In today’s tech-centric educational world, this mindset is helping science teachers figure out what does (and doesn’t) work for engaging students in STEM topics while also preparing them for college and/or career success. If something doesn’t work, then we just modify it and try again.
Science is a learning experience for everyone, so don’t ever be afraid to try something new. If you fail more than you succeed, then that’s what it’s all about. Even if the thought of jumping in feet first scares you a little, just keep in mind that if it helps your students, then you’ll all come out winners in the long run.
For more, see:
- Workspace Education: A Creative Approach to Competency- and Project-Based Science
- 50 Resources for Makers and Creative Classrooms
- Science Holds the Promise of a Better Future
Regina Ahmann is a zoology and AP environmental science teacher at East Coweta High School in Georgia. Follow the Coweta School System on Twitter: @CowetaSchools
Stay in-the-know with innovations in learning by signing up for the weekly Smart Update.


0 Comments
Leave a Comment
Your email address will not be published. All fields are required.