
7 Key Findings From the Babson Online Report Card

This post presents some highlights from Online Report Card – Tracking Online Education in the United States, the thirteenth (and final) annual report on the state of online learning in U.S. higher education. The survey is designed, administered and analyzed by the Babson Survey Research Group, with additional data from the National Center for Education Statistics’ Integrated Postsecondary Education Data System (IPEDS). In partnership with the Online Learning Consortium (OLC), Pearson, WCET, StudyPortals, and Tyton Partners. The study is aimed at answering fundamental questions about the nature and extent of online education.
1. Enrollment of Students Taking At Least One Course at a Distance
With more than one in four students (28%) taking some of their courses at a distance, these courses seem to have become a common part of the course delivery modality for many students. More than two-thirds (67%) of students enrolled in “At Least One” distance course do so at a public institution.
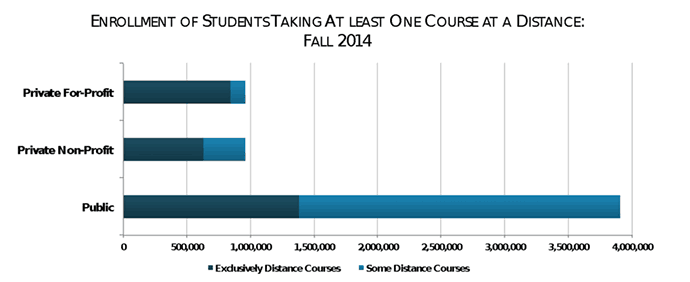
There is variation in the proportion of students taking “At Least One” course at a distance by sector:
- 27% of public institution students took at least one distance course.
- 23% of private non-profit students took at least one distance course.
- 60% of private for-profit students took at least one distance course.
Judging by the enrollments, private colleges may view distance courses as primarily a tool to service distance students. Public colleges, on the other hand, appear to incorporate distance courses for both on-campus and distance students.
2. Change in Distance Enrollments
Distance education enrollments continue to grow at a healthy rate, showing a 7% increase overall between fall 2012 and fall 2014. The growth in distance enrollments among public and private non-profit institutions during this time of overall enrollment decline is noteworthy. Many institutions are continuing to add distance education programs and grow existing ones even while campus-based enrollments are declining.
The 2012 to 2014 growth represents 403,420 additional distance students over this two-year time period. Comparing 2014 distance enrollments to data from 2012 reveals great disparities by sector:
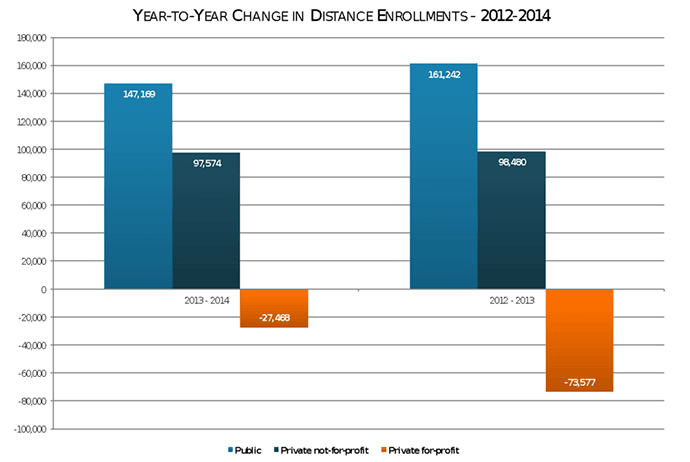
- The not-for-profit sector experienced tremendous growth (26%, or 196,054 students).
- The for-profit sector experienced a significant decrease (-10%, or -101,045 students).
- Public institutions experienced a 9% growth (308,411 students).
The for-profit sector almost fell to last place among sectors enrolling the most distance education students. This is a remarkable outcome, considering the for-profit sector led the private, non-profit sector by more than one-quarter million (297,521) enrollments in 2012. In 2014, that difference fell to only 422 enrollments.
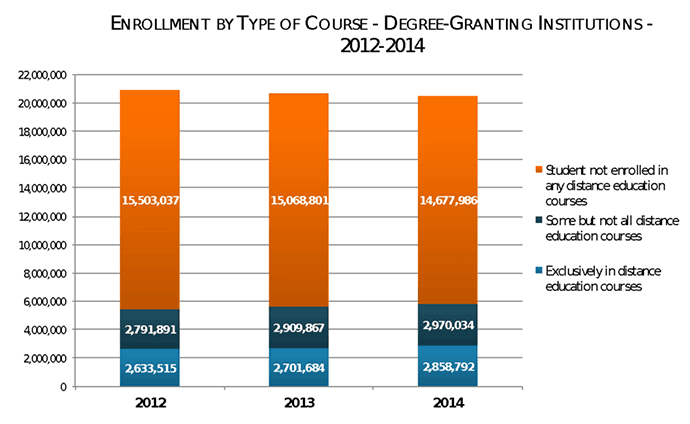
3. Decreasing Overall Enrollments
The growth in the number of distance education students is all the more impressive given the shrinking overall enrollments in higher education during this same time period. Overall enrollments decreased by 248,091 students from 2012 to 2013, and then by a further 173,540 from 2013 to 2014.
The combination of shrinking overall enrollments and growing distance enrollments means that the number of students not taking any distance education course has decreased even faster, losing 434,236 students between 2012 and 2013 and 390,815 from 2013 to 2014. There were 825,051 fewer students not taking any distance courses in 2014 than two years earlier in 2012.
4. Distance Enrollments by Vary Type of Institution
There are nearly five times as many undergraduate enrollments (4,862,519) as graduate enrollments (966,307) among students taking at least one distance education course. Public institutions represent nearly three out of four (73%) distance education enrollments at the undergraduate level. Private, non-profit institutions represent 12% of undergraduate distance enrollments, while private for-profits institutions represent 15%.
5. Distance Enrollments Highly Concentrated in Small Number of Institutions
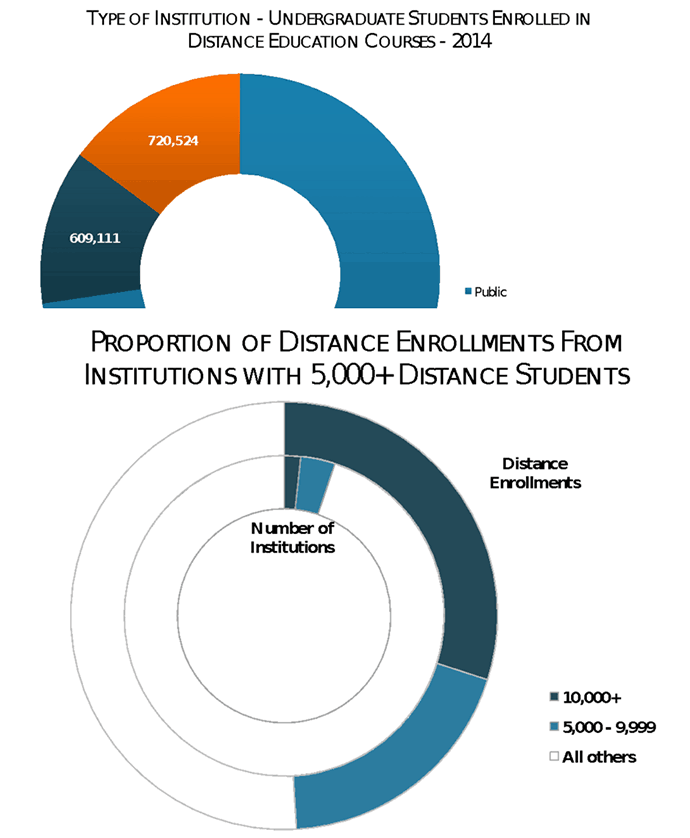 Students enrolled in distance education are highly concentrated in a relatively small number of institutions. There were 4,806 active degree-granting institutions open to the public in fall of 2014 in the IPEDS data files. The 5,828,826 fall 2014 students enrolled in distance education courses were spread across 3,324 (69.2%) of these institutions. However, almost half of these students are concentrated in just five percent of the institutions: the 247 institutions with 5,000 or more distance enrollments represent only 5.1% of all institutions, but 49.1% of the student enrollments. The 80 institutions with 10,000 or more distance enrollments represent only 1.7% of all institutions, but command 29.8% of all distance enrollments.
Looking at this in another way, the top 1% of all institutions represents 29.8% of distance enrollments, and the top 10% of institutions represent 64.5%. Having close to two-thirds of all distance enrollments in only 10% of all higher education institutions is a very high degree of concentration.
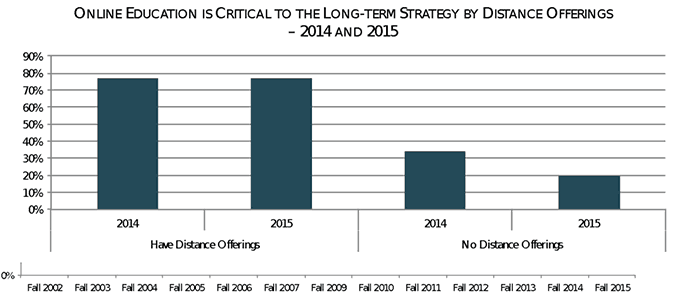
Long-term Strategy. Over time the proportion of institutions agreeing that “Online education is critical to the long-term strategy of my institution” has shown small year-to-year increases. Results for 2015 show the largest-ever drop in the proportion of institutions reporting that online education is critical to their long-term strategy: from 70.8% in 2014, to 63.3% in 2015. Examining this drop reveals that those institutions with online offerings are just as positive as ever, but those who have no offerings are no longer saying that it will be part of their future plans.
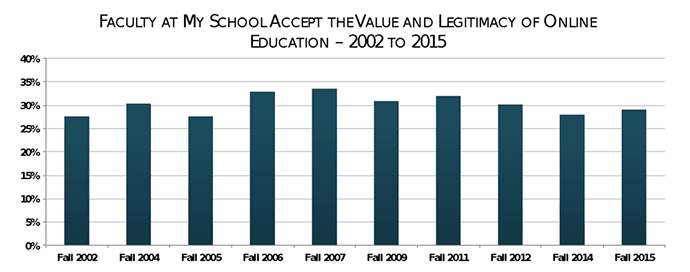
6. Faculty Skepticism Remains High
Even after a decade of substantial growth in the number of schools with distance offerings and the number of students taking these courses, the level of skepticism among faculty has remained very high. Only a small portion of academic leaders report that their faculty “accept the value and legitimacy of online education.” The trend over the past several years has been one of little change from year to year. A continuing failure of online education has been the inability to convince its most important audience – higher education faculty members – of its worth.
7. Learning Outcomes
It is always hard the judge the quality of something where there is no universally agreed upon metric. Such is the case for education – where there is no single measure of education quality – either for face-to-face or for distance education. Therefore, it is important to understand that chief academic officers are reporting their personal perceptions about the relative quality of online and face-to-face instruction.
The proportion of academic leaders that rated online education as good as or better than face-to-face instruction was 57.2% in 2003. The relative view of online quality has improved over time, with a pattern of slow but steady improvement in the relative view of online learning outcomes from 2003 until 2012, where 77.0% of the respondents rated online as good or better. Results since then, however, have shown been less positive, with the responses for 2015 showing only 71.4% rating online as good or better.
For more, check out:
- CREDO Study of Online Learning Gets an Incomplete
- 8 Online Learning Trends that are Changing the Learning Landscape
- Improving Access and Equity in Blended and Online Learning
Jeff Seaman is director of the Babson Survey Research Group. Follow Babson College on Twitter, @babson.
Stay in-the-know with all things EdTech and innovations in learning by signing up to receive the weekly Smart Update.


0 Comments
Leave a Comment
Your email address will not be published. All fields are required.