
Designing The Future, Starting with What We Know About Schools

Katherine Ward & Chris Given
Making school data accessible and actionable is one of the most powerful ways to foster engagement with and promote informed decisions by those closest to the learning process—students and families.
In the current climate of intense change in education timely and relevant data about what’s happening in schools is the key to empowering students, parents and other stakeholders to shape the future of education, particularly as curriculum has shifted across the board and next-generation assessments are supplanting the array of state accountability tests across the country.
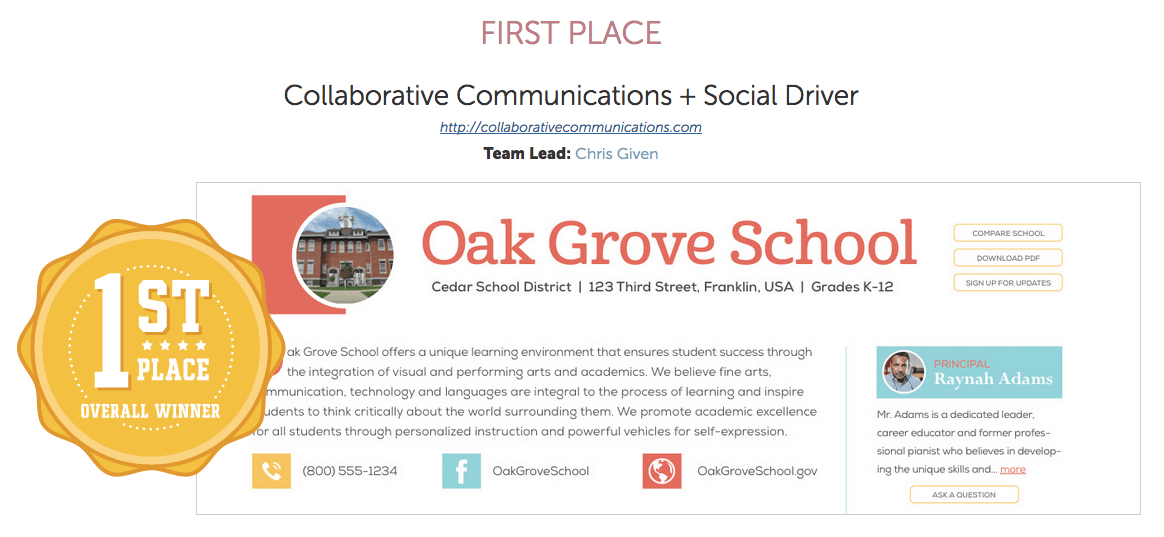
We are passionate about our work to improve our education system at Collaborative Communications. Together with our partners at Social Driver, our winning designs in the Foundation for Excellence in Education’s My School Information Design Challenge are one way we are approaching our big agenda to change the way communities understand and participate in improving their public schools.
Here’s how we approached the challenge.
Current school report cards, developed and shared variably by states, districts and networks, offer a narrowly prescribed set of information about schools. Many provide just a small window into what’s happening in a school building and leave parents on the outside, looking in. Common understanding is scarce.
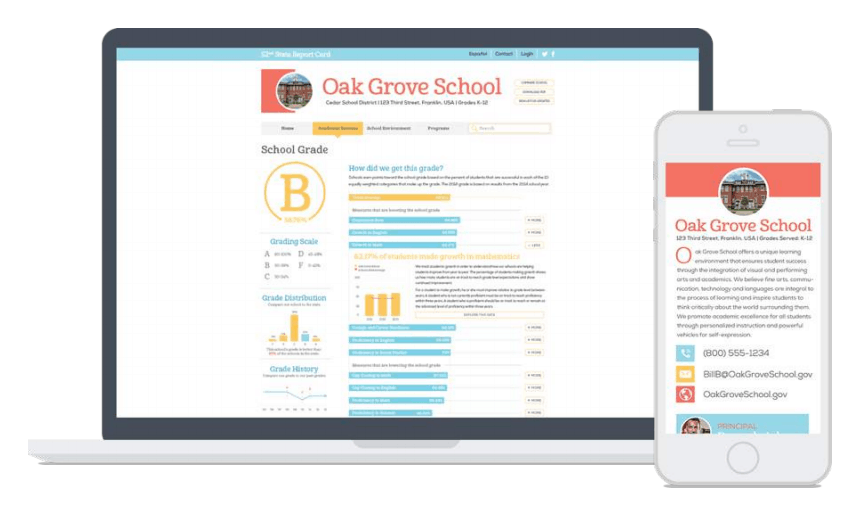
What if public reporting of data was not only easier to understand, but could be used to spark a conversation between communities and their schools? More than simply a repository of numbers, interactive online report cards could be the answer. If done well, they would be a living resource and a forum for conversations about data and what’s happening in schools.
We imagine a public reporting platform that facilitates conversations and inspires action by educators, administrators and communities. This platform could bring new questions to the surface and allow districts and schools to respond with specific, meaningful and actionable answers. Instead of just serving up a snapshot in time via a static webpage, we could promote ongoing parent and community engagement.
While technology is not a magic bullet, today we have the tools to make information easier to access and more compelling than ever before. As we embrace these tools, our designs and supporting content must serve to provide context and meaning for interested parties. We must directly link the information to actions that stakeholders take every day. And we must listen to our users, understand their needs and learn what they know.
Public school data is not only of use to administrators and wonks. Everyone in our education community deserves the opportunity to get inspired by this data and to tell his or her own stories about what’s happening in schools. With this data, parents can make informed school choices; students can make decisions about their own pathway to college and career; administrators can identify successes and areas for improvement; and policymakers can determine how reforms are impacting student learning. All of these participants have a role to play, and all should feel ownership of this information.
Here are a few essential concepts to getting this right that we highlighted through our winning designs:
- Sort and group school data so that it is organized to promote action and user understanding, while inviting users to drill deeper into the data by sequencing information complexity.
- More than simply explaining what data is, include information that helps users understand context about the information and why it should matter to them.
- Encourage users to ask questions about what they see to inform future enhancements and create a growing repository of knowledge.
Find more highlights of our approach in our design presentation.
These concepts are just a few of the best practices we consider in developing interactive report cards. There is no one solution to public reporting that meets the needs of all networks of schools – one size doesn’t fit all. Public reporting must invite users to explore and compare key pieces of information appropriate to the focus and character of each school and the grades served. Empowering school leaders, students and stakeholders to contribute to data about schools is vital, as is offering continuous updates to information.as soon as they becomes available.
We’re inspired by the many stories the data is telling about schools for our partners in Washington, DC and Illinois. Where will the conversation take us next?
Katherine Ward, Vice President and Chris Given, Senior Creative Technologist work together to integrate technology and interactivity into engagement initiatives in public education at Collaborative Communications.


0 Comments
Leave a Comment
Your email address will not be published. All fields are required.